How to Read a P&L
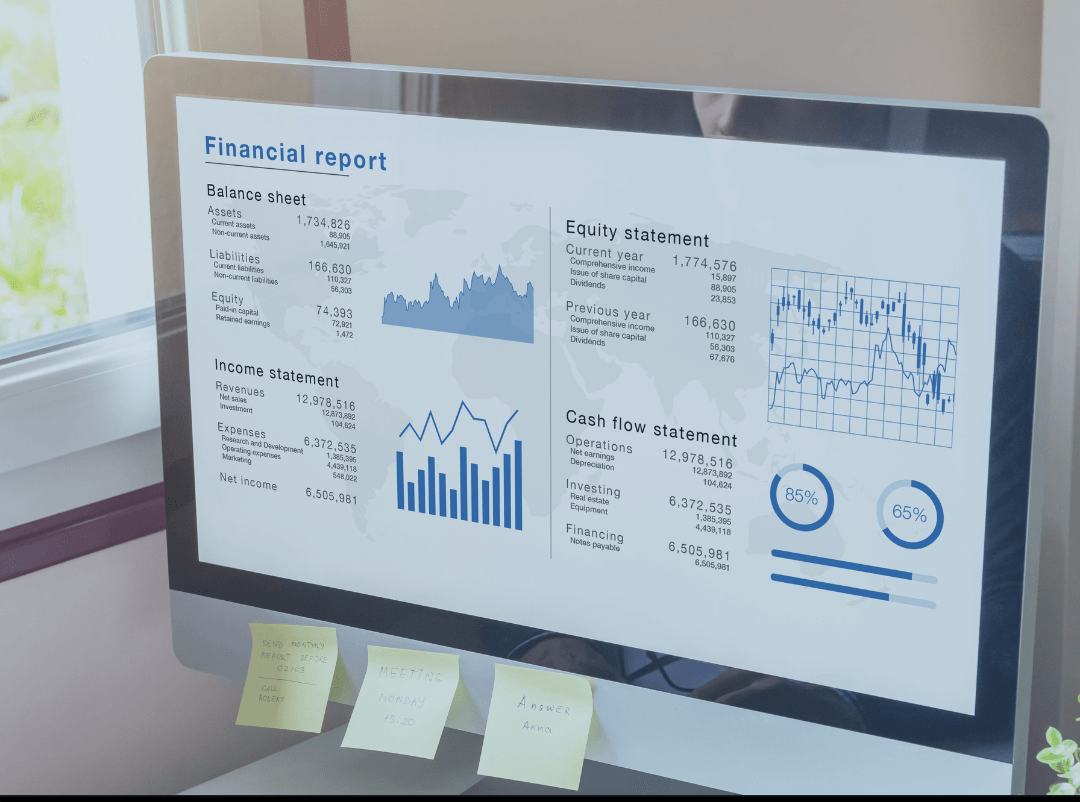
A Profit & Loss (P&L) statement, also known as an income statement, is one of the most essential financial documents for any business. It provides a snapshot of your company’s revenues, costs, and expenses over a specific period, helping you gauge profitability and financial health. But if you’re not an accountant, reading a P&L can feel like deciphering another language.
At GrowthLab, we work with business owners and finance teams every day to help them make sense of their numbers. In this guide, we’ll break down how to read a P&L statement like a pro so you can make informed decisions that drive business growth.
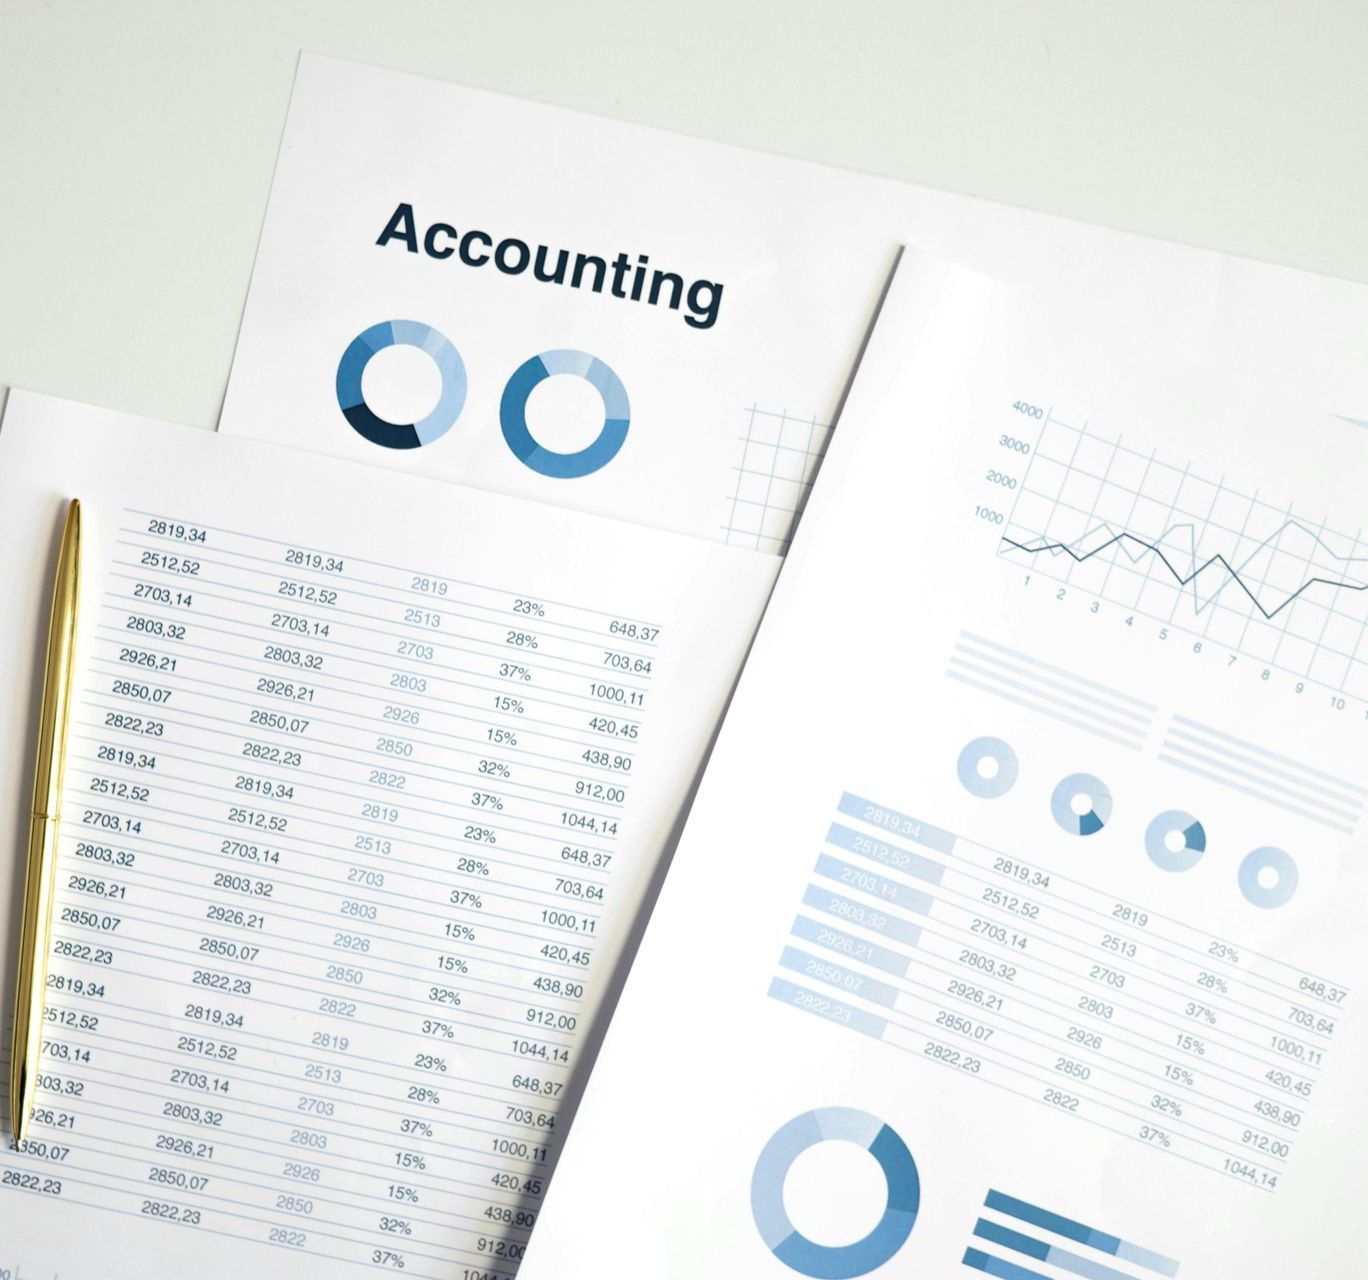
Understanding the Key Sections of a P&L Statement
A well-structured P&L statement typically consists of the following sections:
1. Revenue (Top Line)
This is the total income your business generates before any expenses are deducted. Revenue can come from various sources, such as product sales, service fees, or subscriptions. Be sure to check whether your revenue is reported on a cash or accrual basis, as this impacts how income is recognized.This is also called Gross Receipts or Gross Revenues.
Related Read:
Cash vs. Accrual Accounting: Which is Better for Your Business?
2. Cost of Goods Sold (COGS)
COGS includes all the direct costs associated with producing goods or delivering services. For example:
- A bakery’s COGS would include flour, sugar, and labor costs.
- A consulting firm’s COGS might include contractor payments.
Understanding your COGS helps determine your
gross profit margin, which is a critical profitability metric. Overhead expenses, such as Office supplies, would not be part of COGS, only direct expenses as stated above. For more tips on small business bookkeeping and tracking expenses, read our guide on
Bookkeeping Basics for Small Business Owners.
3. Gross Profit
Calculated as: Revenue - COGS = Gross Profit
This tells you how much money is left after covering direct costs. A strong gross profit margin indicates efficient cost management and pricing strategy.
4. Operating Expenses (OPEX)
These are indirect costs incurred in running your business, including:
- Rent & utilities
- Marketing & advertising
- Payroll & benefits
- Software subscriptions
Monitoring OPEX is crucial for maintaining a healthy profit margin.
Pro Tip: If your operating expenses are creeping up, it might be time to reassess spending and identify cost-cutting opportunities. You can see this by looking at a month to month P&L report.
5. Operating Profit (EBITDA)
Gross Profit - Operating Expenses = Operating Profit
Also known as EBITDA (Earnings Before Interest, Taxes, Depreciation, and Amortization), this metric gives a clearer picture of operational efficiency before financial and accounting adjustments.
Further Reading:
How to Calculate EBITDA
6. Net Profit (Bottom Line)
Operating Profit - Taxes, Interest, Depreciation = Net Profit
This is the final profitability figure, showing what’s left after all expenses are deducted. If your net profit is consistently low or negative, it’s time to revisit your revenue strategy and cost structure.
Further Reading:
What Does a Small Business CFO Really Do?
Tips for Analyzing Your P&L Like a CFO
- Look for Trends: Compare your P&L across multiple periods to identify revenue patterns, expense trends, and seasonality effects.
- Benchmark Against Industry Averages: Tools like IBISWorld or BizMiner can help you understand where your business stands.
- Calculate Key Ratios: Gross Margin, Operating Margin, and Net Profit Margin provide valuable insights into financial efficiency.
- Tie It Back to Strategy: A P&L should guide decision-making. If margins are shrinking, you may need to adjust pricing, renegotiate supplier costs, or optimize operations.
Understanding your P&L statement isn’t just about reading numbers—it’s about gaining insights that drive smarter business decisions. If you need help making sense of your finances, GrowthLab is here to help. Let’s turn your P&L into a tool for business growth!
Frequently Asked Questions
How often should I review my P&L statement?
At a minimum, you should review your P&L monthly. However, for rapidly growing businesses or those facing financial challenges, weekly or biweekly reviews can provide better insights.
What’s the difference between a P&L and a balance sheet?
A P&L shows profitability over time, while a balance sheet provides a snapshot of assets, liabilities, and equity at a specific point.
Related Read: What is the Purpose of a Balance Sheet?
What’s a healthy net profit margin?
This varies by industry.
Generally:
Service businesses: 15-25%
SaaS: 20-40%
Retail: 5-10%
Use industry benchmarks for a better comparison.
How can I improve my gross profit margin?
- Increase prices strategically
- Reduce production or service costs
- Improve operational efficiency
- Optimize vendor and supplier relationships
- Check your recurring expenses, to see if you can get any discounts from vendors
- Trim expenses where possible
Where can I get help analyzing my P&L?
GrowthLab specializes in financial planning, accounting, and advisory services. If you need expert guidance, reach out to us here.
Other Blogs Related to Accounting
